

Speed and quality are suffering
We are in a new era where data is highly available. In addition, we have shiny new tools that help us make use of this data in ways we’ve never been able to before. Data scientists in tech firms and traditional businesses can quickly access, shape and draw insights from data. These insights are quickly put into a view or dashboard and delivered to the user who is seeing this for the first time. In the best case, after several iterations and a lengthy development process, a better tool emerges. In the worst case, user feedback is not requested nor given, and the user briefly glances at the tool and then promptly forgets it. In each case, the insight is not being communicated in a way that is particularly engaging, useful nor ease to use.
It’s a tough problem
So why aren’t we communicating our insights well? Often businesses do not have the knowledge nor the skills to design great visualisations. Despite many business attempting to improve this, most visualisations are still created on the fly after the data analysis has been performed. There is no well-established process that teams can easily follow to achieve better data visualisations.
Enter the Data Visualisation Design process
This process enables you to make evidence-based decisions on the optimal way of presenting insights to your users. Here at Project X, this process consists of user research, design, production and testing. It is embedded from beginning to end in both agile and waterfall projects.
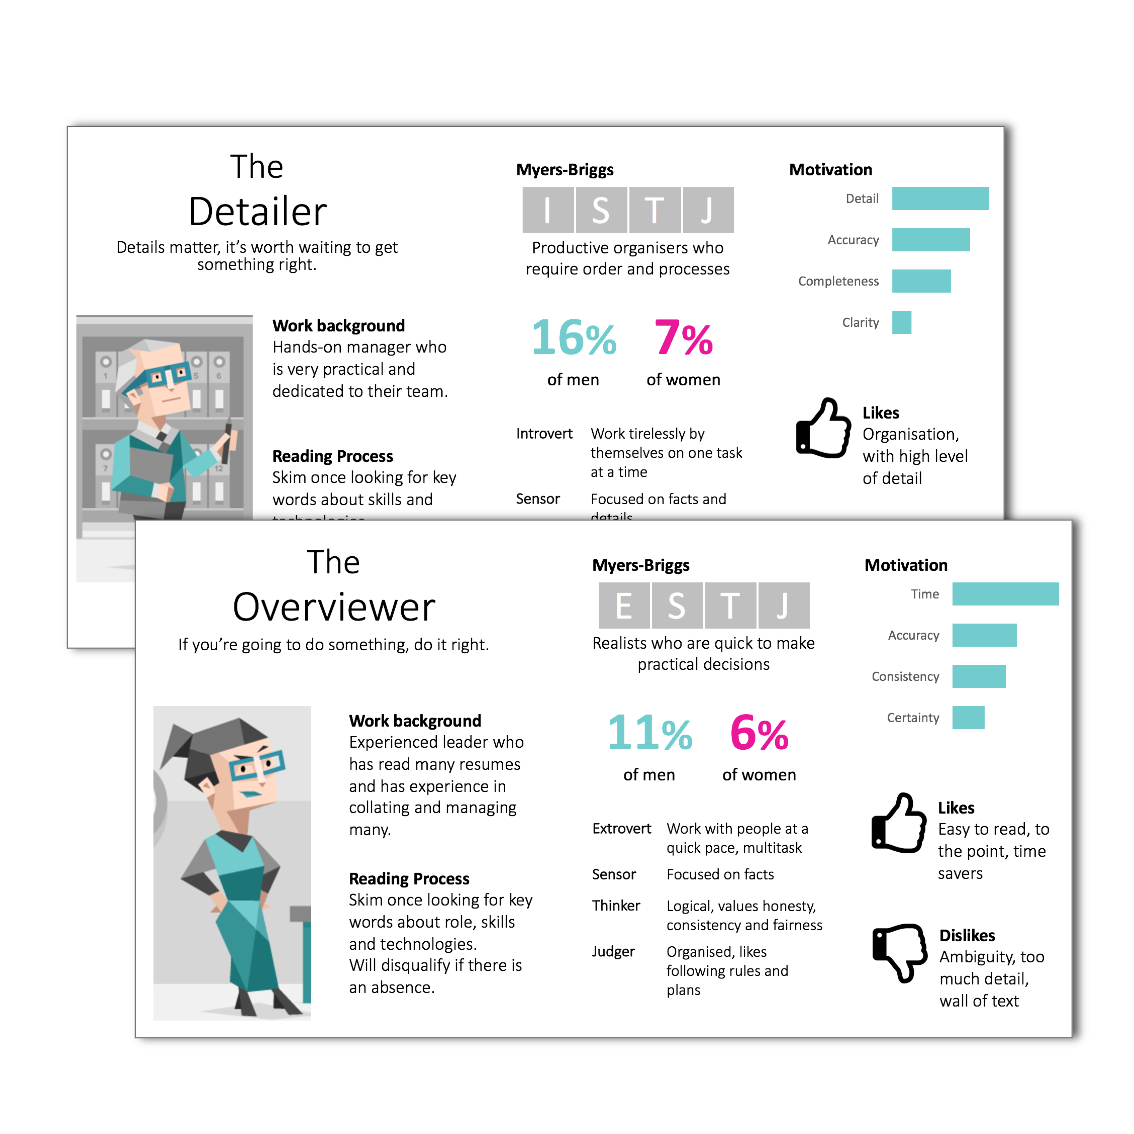
User research
This phase produces accurate and detailed user research which will set your visualisations up for success on the first release, reducing time spent on post-development support and bug fixes. User experience techniques such as focus groups, user interviews, personas, contextual enquiries, process mapping, analytics reviews and competitor reviews are used. This produces a robust set of requirements which accurately represent the needs, motivations and quirks of your users. This data will give you the best chance of creating a product your users will enjoy and use.
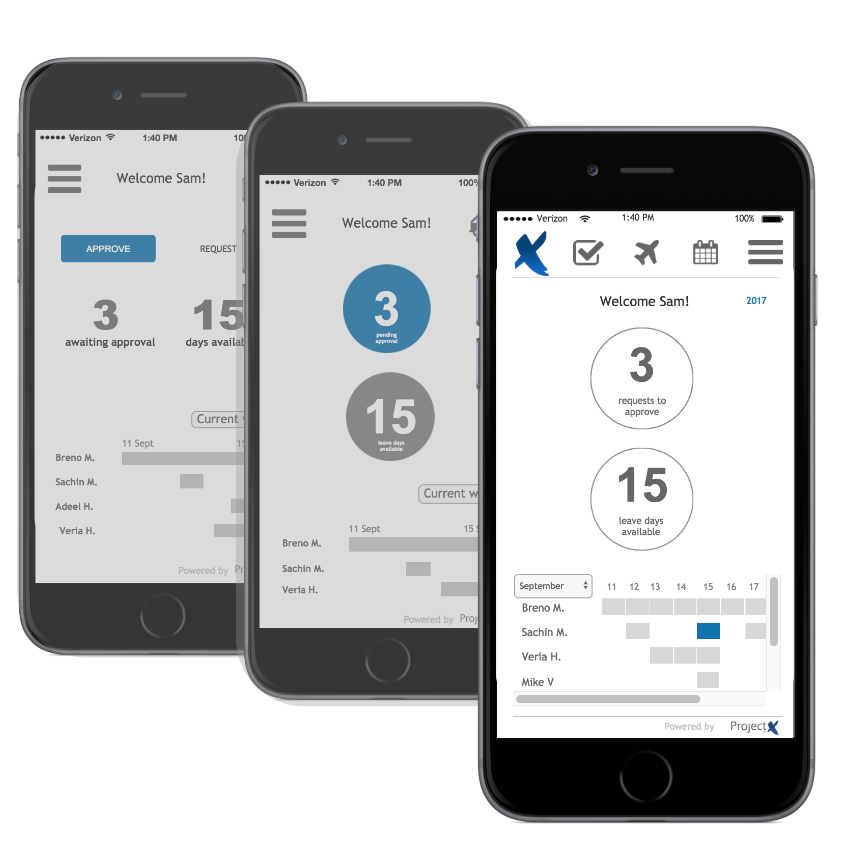
Design
The design phase produces a user-tested, finalised and approved wireframe before front-end development begins, thereby reducing rework during development due to changing requirements. Using collaborative design and wireframing, rapid paper prototypes can be created and tested with users while back end infrastructure and data sets are created. The collaborative nature of this approach means design and UX knowledge is transferred to all members of the team, speeding up future projects.
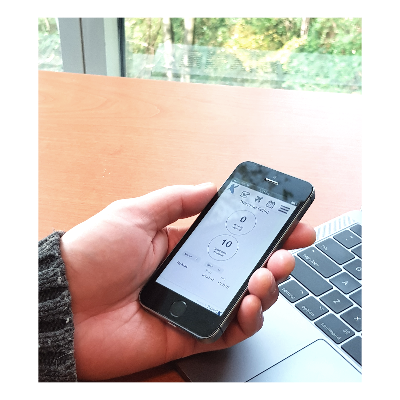
Production & Testing
The product is developed and tested against the paper prototype. Next, the product is officially launched to the users, highlighting key functionalities and benefits. Feedback is gathered from users and recorded for future enhancements.
Conclusion
As many businesses look to improve the way insights are communicated, an established data visualisation design process will increase speed and quality. Project X’s user-focused, collaborative data visualisation design approach enables faster development with less rework, less bug fixes and post-development support, and knowledge transfer to the entire team. If you want find out more about our data visualisation design services contact us.